Ageing
Ageing is an obvious process and doesn’t really warrant any documentation, but I thought this could also be a good place to put some information relating to the age structure of the population as well as some information on how child ages are updated in the module. (For the record, the age of each individual is incremented by 1 with each wave of simulation).
handover_ordinal(raw.dat, base.dat, var = 'age_bucket')
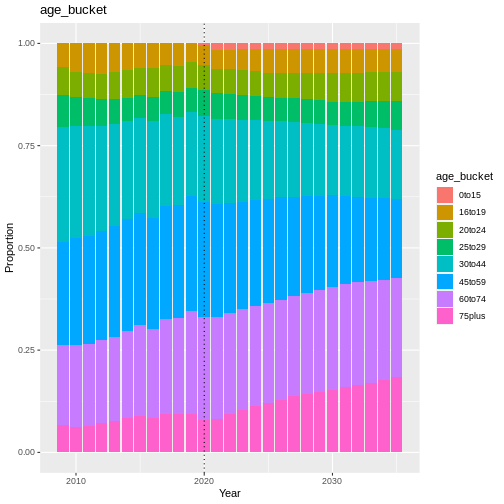
plot of chunk age_structure
Child Ages
Something else that happens in the ageing module is that child ages are
also incremented. Child ages are held in a single string column in the
interest of reducing the data size. For example, a child_ages value
of 2_4_7 indicates a household with 3 children aged 2, 4, and 7. The
function Ageing.update_child_ages() increments ages in these strings
each time step.
child_ages_lineplot(raw.dat, base.dat)
## Error in `summarise()`:
## ℹ In argument: `child_ages = find_mode(child_ages)`.
## ℹ In group 1: `time = 2014`, `hidp = 68088410`.
## Caused by error in `find_mode()`:
## ! could not find function "find_mode"