Mental Well-Being
Mental wellbeing is one of the key output of MINOS.
To measure mental wellbeing, we use the Short-Form 12 Mental Component Score (SF-12 MCS). The Short-Form 12 survey is a survey consisting of 12 questions relating to both physical and mental health. See here for a copy of the survey.
Summary scores for both mental and physical health can be calculated
from the responses, leading to the Mental Component Score (MCS). MCS is
a measure ranging from 0 (low functioning) to 100 (high functioning).
SF-12 MCS is represented by a variable directly from the survey -
`sf12mcs_dv <https://www.understandingsociety.ac.uk/documentation/mainstage/variables/sf12mcs_dv/>`__.
Each of the responses to the 12 questions are also available in the
survey.
continuous_density(obs)
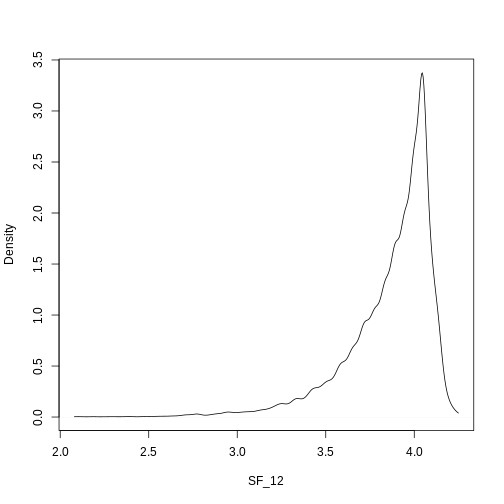
plot of chunk unnamed-chunk-1
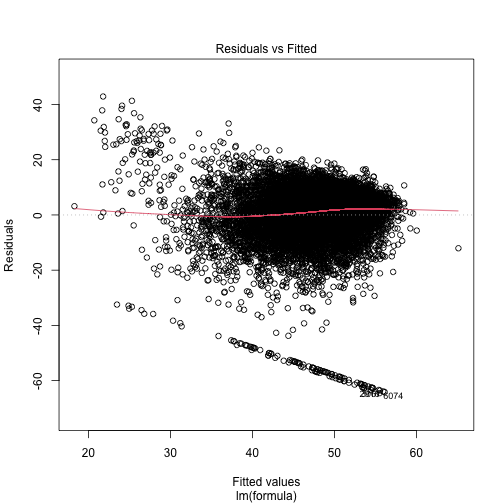
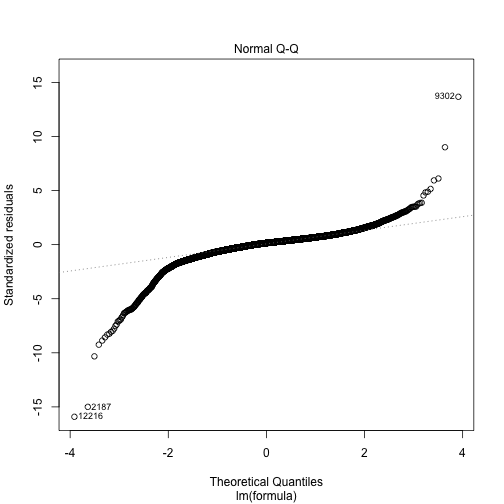
Transition Model
We use a Linear Mixed Model (LMM) from the lme4 package in R.
Formula:
Predictor |
Description |
Li terature/Justification |
|---|---|---|
Previous Mental Wellbeing |
||
Sex |
||
Age |
||
Ethnicity |
||
Region |
Administrative region of the UK |
|
Education |
Highest attained qualification |
|
Household Income |
||
Housing Quality |
||
Neighbourhood Safety |
(Ruijsbroek et al. 2014) (Putrik et al. 2019) |
|
Loneliness |
||
Nutrition Quality |
||
Tobacco Use |
print(summary(model))
## Linear mixed model fit by REML ['lmerMod']
## Formula: SF_12 ~ time + scale(SF_12_last) + scale(age) + factor(sex) +
##     relevel(factor(ethnicity), ref = "WBI") + relevel(factor(region),
##     ref = "Scotland") + relevel(factor(education_state), ref = "1") +
##     scale(hh_income) + factor(housing_quality) + factor(neighbourhood_safety) +
##     factor(loneliness) + scale(nutrition_quality) + scale(ncigs) +
##     I(factor(ncigs > 0)) + (1 | pidp)
##    Data: data
## Weights: weight
##
## REML criterion at convergence: Inf
##
## Scaled residuals:
##     Min      1Q  Median      3Q     Max
## -56.577  -0.245   0.098   0.388  16.055
##
## Random effects:
##  Groups   Name        Variance Std.Dev.
##  pidp     (Intercept) 0.006622 0.08138
##  Residual             0.002256 0.04750
## Number of obs: 54222, groups:  pidp, 28092
##
## Fixed effects:
##                                                                     Estimate
## (Intercept)                                                        4.9130185
## time                                                              -0.0005121
## scale(SF_12_last)                                                  0.1147981
## scale(age)                                                         0.0213196
## factor(sex)Male                                                    0.0201720
## relevel(factor(ethnicity), ref = "WBI")BAN                         0.0003187
## relevel(factor(ethnicity), ref = "WBI")BLA                         0.0292480
## relevel(factor(ethnicity), ref = "WBI")BLC                         0.0182470
## relevel(factor(ethnicity), ref = "WBI")CHI                         0.0156512
## relevel(factor(ethnicity), ref = "WBI")IND                        -0.0006693
## relevel(factor(ethnicity), ref = "WBI")MIX                        -0.0035133
## relevel(factor(ethnicity), ref = "WBI")OAS                        -0.0014411
## relevel(factor(ethnicity), ref = "WBI")OBL                        -0.0010133
## relevel(factor(ethnicity), ref = "WBI")OTH                        -0.0698165
## relevel(factor(ethnicity), ref = "WBI")PAK                         0.0055012
## relevel(factor(ethnicity), ref = "WBI")WHO                         0.0153349
## relevel(factor(region), ref = "Scotland")East Midlands             0.0111865
## relevel(factor(region), ref = "Scotland")East of England           0.0051783
## relevel(factor(region), ref = "Scotland")London                    0.0015321
## relevel(factor(region), ref = "Scotland")North East               -0.0045410
## relevel(factor(region), ref = "Scotland")North West                0.0017339
## relevel(factor(region), ref = "Scotland")Northern Ireland          0.0007917
## relevel(factor(region), ref = "Scotland")South East                0.0018979
## relevel(factor(region), ref = "Scotland")South West               -0.0022499
## relevel(factor(region), ref = "Scotland")Wales                    -0.0052200
## relevel(factor(region), ref = "Scotland")West Midlands            -0.0012001
## relevel(factor(region), ref = "Scotland")Yorkshire and The Humber  0.0010755
## relevel(factor(education_state), ref = "1")0                      -0.0077798
## relevel(factor(education_state), ref = "1")2                       0.0042615
## relevel(factor(education_state), ref = "1")3                       0.0007323
## relevel(factor(education_state), ref = "1")5                       0.0107278
## relevel(factor(education_state), ref = "1")6                       0.0025737
## relevel(factor(education_state), ref = "1")7                       0.0005955
## scale(hh_income)                                                   0.0058137
## factor(housing_quality)Medium                                     -0.0034585
## factor(housing_quality)Low                                        -0.0333144
## factor(neighbourhood_safety)2                                      0.0040437
## factor(neighbourhood_safety)3                                      0.0164410
## factor(loneliness)2                                               -0.0767774
## factor(loneliness)3                                               -0.2659751
## scale(nutrition_quality)                                           0.0091674
## scale(ncigs)                                                      -0.0060226
## I(factor(ncigs > 0))TRUE                                          -0.0132155
##                                                                   Std. Error
## (Intercept)                                                        0.8338149
## time                                                               0.0004135
## scale(SF_12_last)                                                  0.0011464
## scale(age)                                                         0.0012655
## factor(sex)Male                                                    0.0022776
## relevel(factor(ethnicity), ref = "WBI")BAN                         0.0142276
## relevel(factor(ethnicity), ref = "WBI")BLA                         0.0092479
## relevel(factor(ethnicity), ref = "WBI")BLC                         0.0120408
## relevel(factor(ethnicity), ref = "WBI")CHI                         0.0170623
## relevel(factor(ethnicity), ref = "WBI")IND                         0.0070907
## relevel(factor(ethnicity), ref = "WBI")MIX                         0.0092666
## relevel(factor(ethnicity), ref = "WBI")OAS                         0.0101210
## relevel(factor(ethnicity), ref = "WBI")OBL                         0.0326498
## relevel(factor(ethnicity), ref = "WBI")OTH                         0.0181015
## relevel(factor(ethnicity), ref = "WBI")PAK                         0.0083659
## relevel(factor(ethnicity), ref = "WBI")WHO                         0.0055417
## relevel(factor(region), ref = "Scotland")East Midlands             0.0058743
## relevel(factor(region), ref = "Scotland")East of England           0.0055548
## relevel(factor(region), ref = "Scotland")London                    0.0057055
## relevel(factor(region), ref = "Scotland")North East                0.0069722
## relevel(factor(region), ref = "Scotland")North West                0.0055007
## relevel(factor(region), ref = "Scotland")Northern Ireland          0.0079141
## relevel(factor(region), ref = "Scotland")South East                0.0052191
## relevel(factor(region), ref = "Scotland")South West                0.0056514
## relevel(factor(region), ref = "Scotland")Wales                     0.0071922
## relevel(factor(region), ref = "Scotland")West Midlands             0.0057215
## relevel(factor(region), ref = "Scotland")Yorkshire and The Humber  0.0057132
## relevel(factor(education_state), ref = "1")0                       0.0084666
## relevel(factor(education_state), ref = "1")2                       0.0084449
## relevel(factor(education_state), ref = "1")3                       0.0088360
## relevel(factor(education_state), ref = "1")5                       0.0089127
## relevel(factor(education_state), ref = "1")6                       0.0085489
## relevel(factor(education_state), ref = "1")7                       0.0087401
## scale(hh_income)                                                   0.0011283
## factor(housing_quality)Medium                                      0.0023848
## factor(housing_quality)Low                                         0.0040415
## factor(neighbourhood_safety)2                                      0.0025319
## factor(neighbourhood_safety)3                                      0.0033646
## factor(loneliness)2                                                0.0025716
## factor(loneliness)3                                                0.0045929
## scale(nutrition_quality)                                           0.0011009
## scale(ncigs)                                                       0.0014733
## I(factor(ncigs > 0))TRUE                                           0.0049761
##                                                                   t value
## (Intercept)                                                         5.892
## time                                                               -1.238
## scale(SF_12_last)                                                 100.137
## scale(age)                                                         16.846
## factor(sex)Male                                                     8.857
## relevel(factor(ethnicity), ref = "WBI")BAN                          0.022
## relevel(factor(ethnicity), ref = "WBI")BLA                          3.163
## relevel(factor(ethnicity), ref = "WBI")BLC                          1.515
## relevel(factor(ethnicity), ref = "WBI")CHI                          0.917
## relevel(factor(ethnicity), ref = "WBI")IND                         -0.094
## relevel(factor(ethnicity), ref = "WBI")MIX                         -0.379
## relevel(factor(ethnicity), ref = "WBI")OAS                         -0.142
## relevel(factor(ethnicity), ref = "WBI")OBL                         -0.031
## relevel(factor(ethnicity), ref = "WBI")OTH                         -3.857
## relevel(factor(ethnicity), ref = "WBI")PAK                          0.658
## relevel(factor(ethnicity), ref = "WBI")WHO                          2.767
## relevel(factor(region), ref = "Scotland")East Midlands              1.904
## relevel(factor(region), ref = "Scotland")East of England            0.932
## relevel(factor(region), ref = "Scotland")London                     0.269
## relevel(factor(region), ref = "Scotland")North East                -0.651
## relevel(factor(region), ref = "Scotland")North West                 0.315
## relevel(factor(region), ref = "Scotland")Northern Ireland           0.100
## relevel(factor(region), ref = "Scotland")South East                 0.364
## relevel(factor(region), ref = "Scotland")South West                -0.398
## relevel(factor(region), ref = "Scotland")Wales                     -0.726
## relevel(factor(region), ref = "Scotland")West Midlands             -0.210
## relevel(factor(region), ref = "Scotland")Yorkshire and The Humber   0.188
## relevel(factor(education_state), ref = "1")0                       -0.919
## relevel(factor(education_state), ref = "1")2                        0.505
## relevel(factor(education_state), ref = "1")3                        0.083
## relevel(factor(education_state), ref = "1")5                        1.204
## relevel(factor(education_state), ref = "1")6                        0.301
## relevel(factor(education_state), ref = "1")7                        0.068
## scale(hh_income)                                                    5.153
## factor(housing_quality)Medium                                      -1.450
## factor(housing_quality)Low                                         -8.243
## factor(neighbourhood_safety)2                                       1.597
## factor(neighbourhood_safety)3                                       4.886
## factor(loneliness)2                                               -29.856
## factor(loneliness)3                                               -57.910
## scale(nutrition_quality)                                            8.328
## scale(ncigs)                                                       -4.088
## I(factor(ncigs > 0))TRUE                                           -2.656
##
## Correlation matrix not shown by default, as p = 43 > 12.
## Use print(summary(model), correlation=TRUE)  or
##     vcov(summary(model))        if you need it
## optimizer (nloptwrap) convergence code: 0 (OK)
## Gradient contains NAs
Validation
handover_boxplots(raw.dat, base.dat, v)
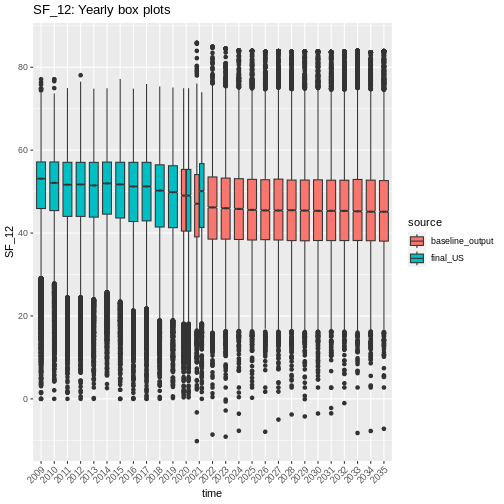
plot of chunk mwb_handovers
#handover_lineplots(raw.dat, base.dat, v)
multi_year_boxplots(raw, cv, v)
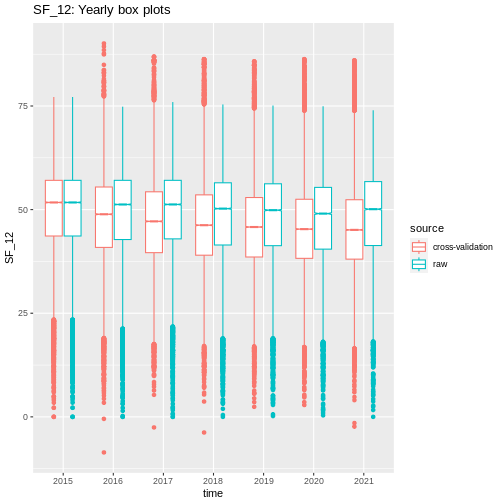
plot of chunk mwb_cv
q_q_comparison(raw, cv, v)
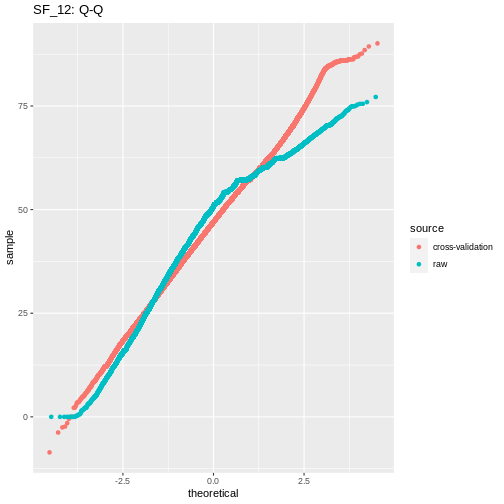
plot of chunk mwb_cv
Results
References
Putrik, Polina, Ludovic Van Amelsvoort, Suhreta Mujakovic, Anton E Kunst, Hans van Oers, IJmert Kant, Maria W Jansen, and Nanne K De Vries. 2019. “Assessing the Role of Criminality in Neighbourhood Safety Feelings and Self-Reported Health: Results from a Cross-Sectional Study in a Dutch Municipality.” BMC Public Health 19: 1–12.
Ruijsbroek, Annemarie, M Droomers, PP Groenewegen, W Hardyns, and K Stronks. 2014. “Social Safety, General Health and Physical Activity: Changes in Neighbourhood Safety and the Role of Social Cohesion: Annemarie Ruijsbroek.” European Journal of Public Health 24 (suppl_2): cku162–070.