Neighbourhood
Neighbourhood
Neighbourhood Safety is a composite derived from 7 questions related to different facets of safety in the neighbourhood.
They are:
burglaries (crburg)
car crime (crcar)
drunks (crdrnk)
muggings (crmugg)
racial abuse (crrace)
teenager issues (crteen)
vandalism issues (crvand)
Each respondent is asked if they are concerned with these issues in their neighbourhood, and response with 1 of:
Hardly ever
Some of the time
Often
We then assign people into three categories:
Very Safe Neighbourhood: Response to all crime questions is “not at all common”. Justification is that if you perceive no threat at all this is the best possible state.
Safe Neighbourhood: Responds to 1+ question as “not very common” but no responses to ‘fairly or very common’. Justification is that on the whole these people probably feel safe but not all is perfect, so probably not quite as desirable as group 1.
Unsafe Neighbourhood: Responds to 1+ question as fairly or very common’. Justification is that if perception of crime is very or fairly common, no matter what category, you are likely to feel that your neighbourhood safety is compromised.
IMPORTANT NOTE: The variables listed above that make up neighbourhood_safety are only asked in the survey every 3rd wave, starting in wave 3 (6, 9, 12). This causes a lot of problems and was the most challenging variable to include in the model. First, trying to fit a
Methods
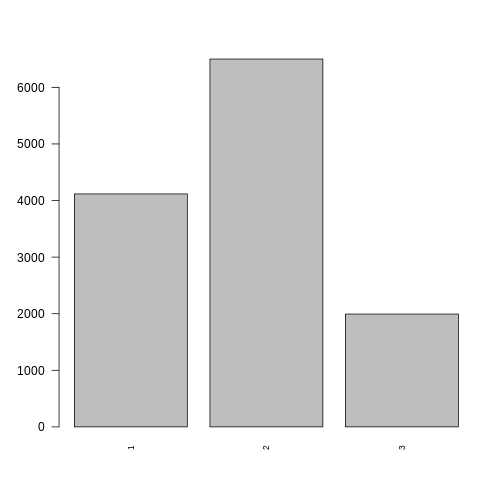
plot of chunk neighbourhood_barchart
Transition Model
We fit a Random Forest Ordinal model from the ranger package in R to estimate transitions for this variable.
Formula:
Predictor |
Description |
Lite rature/Justification |
|---|---|---|
Sex |
||
Age |
||
Ethnicity |
||
Region |
Administrative region of the UK |
|
Education |
Highest attained qualification |
|
Household Income |
||
Behind on Bills |
||
Financial Situation |
plot_rfo_importance(model)
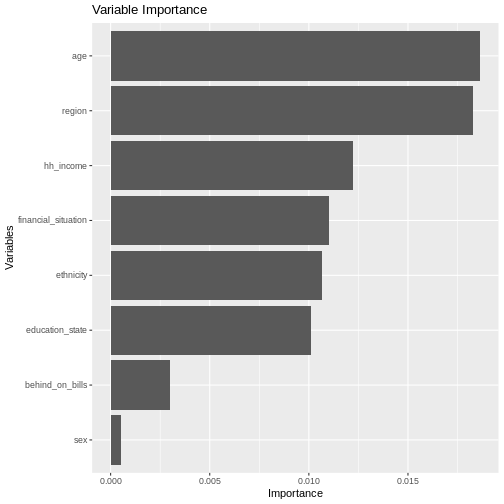
plot of chunk nh_safety_model_summary
Validation
handover_ordinal(raw.dat, base.dat, v)
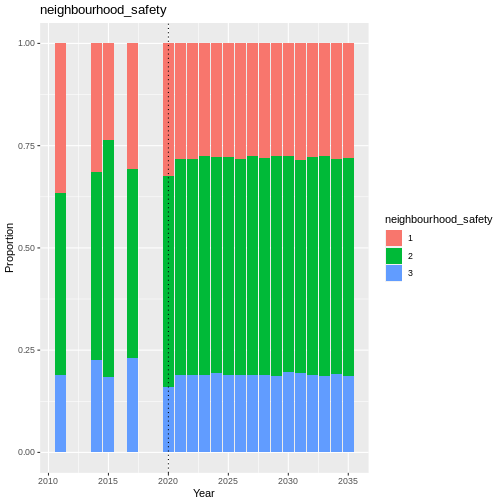
plot of chunk nh_safety_validation
Results
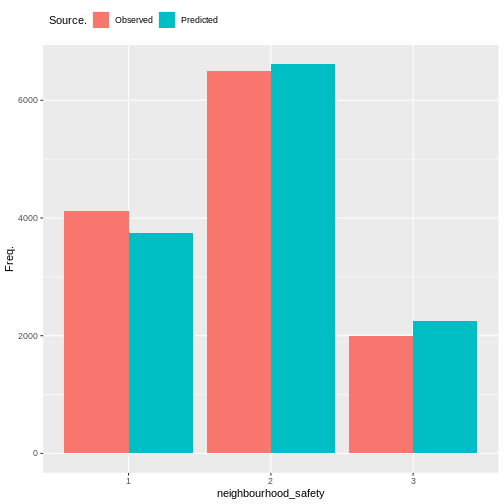
plot of chunk neighbourhood_output
cumulative_link_plot(obs, preds)
## `geom_smooth()` using formula = 'y ~ x'
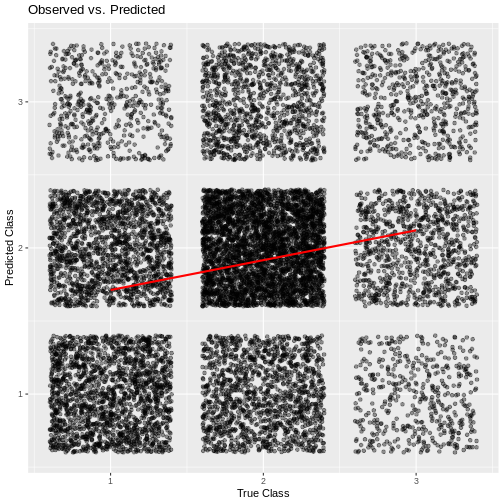
plot of chunk neighbourhood_performance