Validation
For validation MINOS uses 2 methods; ‘handover’ plots and 5-fold cross-validation.
Handovers
Handovers are not a method of statistical validation, but more of a sanity check giving a quick visual indication that the transition models are behaving as we would expect. In these plots, we show the ‘handover’ from the unsimulated survey data to the simulated model output. This shows us whether the trends seen in the survey data are carried on into the simulation, and therefore whether the simulation continues trends from the underlying data.
As an example, see below the handover plots for household income.
### Read data in for handovers plots
# Read raw datafiles in
raw.files <- list.files(here::here('data', 'final_US'), pattern='[0-9]{4}_US_cohort.csv', full.names = TRUE)
raw.dat <- do.call(rbind, lapply(raw.files, read.csv))
raw.dat <- raw.dat %>%
  filter(weight > 0)

out.path <- here::here('output', 'default_config/')
base.dat <- read_singular_local_out(out.path, 'baseline',
                                    drop.dead = TRUE,
                                    drop.zero.weight = TRUE)

# cut off any years of raw data AFTER start year of simulation
if (min(base.dat$time) <= max(raw.dat$time)) {
  raw.dat <- raw.dat %>%
    filter(time <= min(base.dat$time))
}

# cut missing data for key variable
raw.dat <- raw.dat %>%
  filter(!.data[['hh_income']] %in% miss.values)

handover_boxplots(raw.dat, base.dat, 'hh_income')
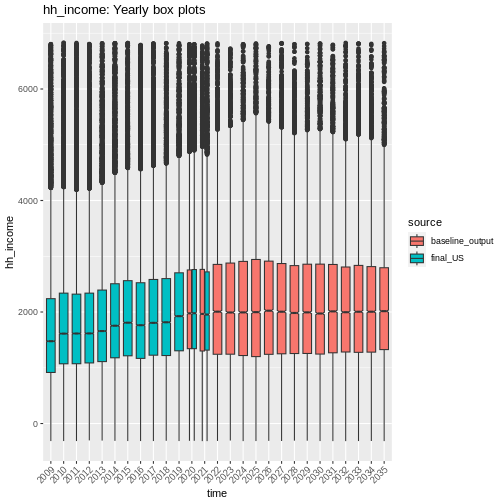
Fig. 62 plot of chunk hh_income_handovers
handover_lineplots(raw.dat, base.dat, 'hh_income')
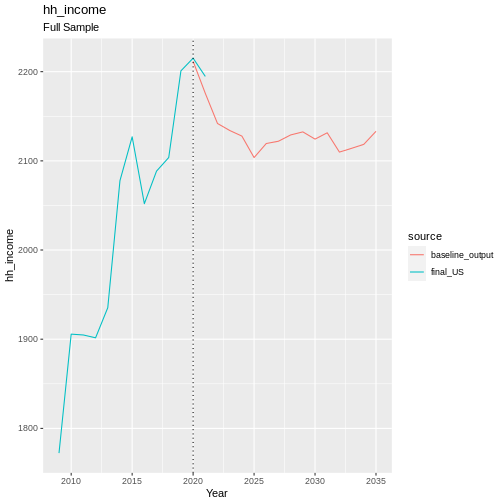
Fig. 63 plot of chunk hh_income_handovers
Cross-Validation
The other form of validation is 5-fold cross-validation (CV), which is a valid form of statistical validation. For CV, we split the survey data into 5 pieces by splitting the list of personal identifiers into 5 equal chunks (this ensures that each chunk of data will have roughly similar numbers of individuals covering the full range of the survey).
With the data split into 5 chunks we can simulate a single each chunk of the data independently, fitting transition models to the other 4/5ths of data before starting. We run each chunk once, starting in 2015 and running to 2021. This allows us to compare our simulated values to the true raw data over this time period, and assessing how our model is performing when trying to recreate real data.
cv.mean.plots(cv1, cv2, cv3, cv4, cv5, raw, 'SF_12')
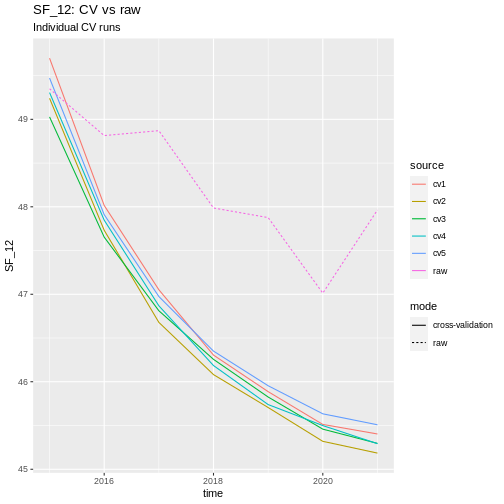
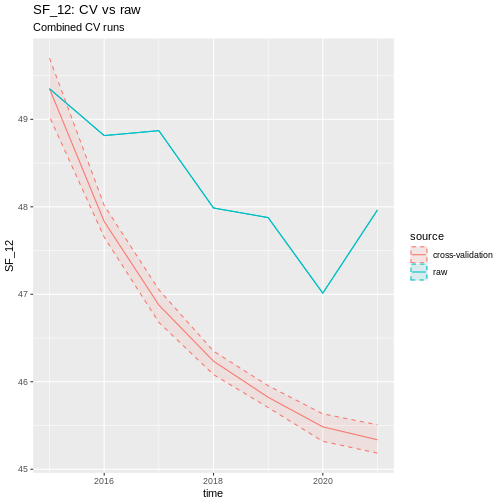
multi_year_boxplots(raw, cv, 'SF_12')
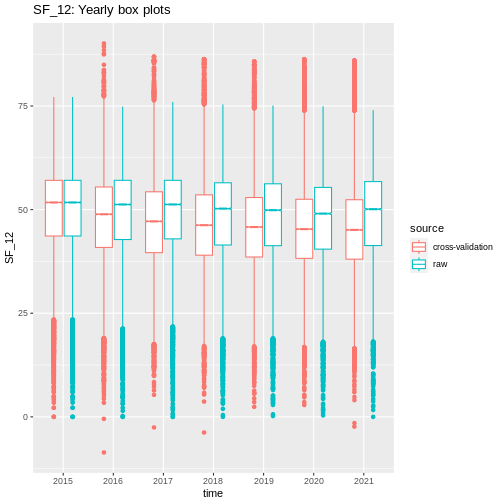
Fig. 64 plot of chunk cv_hh_income_vis
snapshot_OP_plots(raw, cv, 'SF_12', target.years = c(2015, 2017, 2019, 2021))
## Warning: Use of .data in tidyselect expressions was deprecated in tidyselect 1.2.0.
## ℹ Please use `all_of(var)` (or `any_of(var)`) instead of `.data[[var]]`
## This warning is displayed once every 8 hours.
## Call `lifecycle::last_lifecycle_warnings()` to see where this warning was generated.
## Warning in MASS::cov.trob(data[, vars]): Probable convergence failure
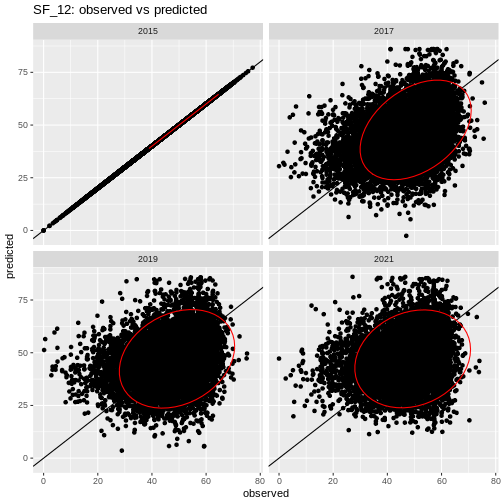
Fig. 65 plot of chunk cv_hh_income_vis
q_q_comparison(raw, cv, 'SF_12')
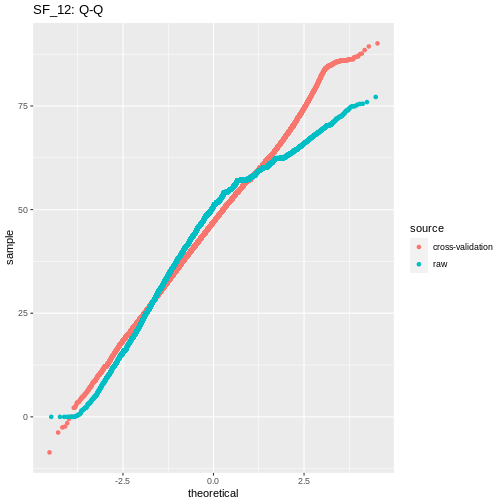
Fig. 66 plot of chunk cv_hh_income_vis